Presented by Summit Financial Corporation
Another strong year for U.S. markets
For the second year in a row, U.S. markets were the place for investors to be, closing the year with a very strong fourth quarter despite a somewhat weak December. The Dow Jones Industrial Average was up 0.12 percent in December, but up a much stronger 5.20 percent for the quarter. The S&P 500 Index actually was down 0.25 percent in December, though it posted a 4.93-percent gain for the quarter. The Nasdaq lost 1.16 percent for the month, pulling down its quarterly gain to a still very strong 5.40 percent.
The strong fourth-quarter returns capped a strong year. Gains were widespread, with the Dow up 10.04 percent for the year, the Nasdaq up an even stronger 13.40 percent, and the S&P 500 doing best of all, gaining 13.69 percent, well above average annual levels of return.
Market gains came on the back of a steadily expanding economic recovery. After a weak first quarter, U.S. economic growth accelerated, with the most recent report on gross domestic product (GDP) growth announcing a 5-percent gain for the third quarter. Corporate revenues and earnings increased as well, providing support for increasing stock prices.
An increase in market valuation levels supported further share price gains. At year-end, U.S. markets were at or close to all-time highs. Technical factors remained strong, with all indices well above major moving average levels.
Looking forward, conditions may prove less favorable, with lower oil prices driving down revenues and earnings in the energy sector and a strong dollar bringing down the impact of foreign revenues. These factors may well have contributed to the anemic December results.
International markets underperformed U.S. markets over the month, quarter, and year, with December being very weak and taking foreign markets into the red. The MSCI EAFE Index, which represents developed international markets, was down 3.46 percent for December and 3.57 percent for the fourth quarter. The MSCI Emerging Markets Index did even worse, declining 4.82 percent in December and 4.88 percent for the fourth quarter.
For the year, developed markets were down 4.90 percent, and emerging markets dropped 4.63 percent, with the bulk of the decline coming in December. Technical factors remained soft, with both indices well below their 200-day moving averages. Weak economic factors, in addition to political difficulties around the world, suggest that this down trend may continue through 2015. Declines in the prices of oil and other commodities hit emerging markets hard, while rising political conflict and continued economic stagnation, particularly in Europe, weighed on developed markets.
Fixed income had a relatively strong year in the U.S. The Barclays Capital Aggregate Bond Index was up 0.10 percent for December and 1.79 for the fourth quarter, contributing to a 5.97-percent gain for the year. This strong performance was driven by a consistent, and unexpected, decline in interest rates throughout 2014.
Rates on the benchmark 10-year U.S. Treasury bond declined from 3 percent to 2.17 percent during the year, despite the Federal Reserve’s (Fed) decision to taper and ultimately end its intervention in the bond market. The decline in rates was largely driven by uncertainty elsewhere in the world, coupled with ongoing governmental stimulus from China, Japan, and, as widely expected, in Europe.
Even as the Fed moved out of the market, other central banks either stayed in or moved to stimulate further. Uncertainty also drove a flight to safety, with investors moving to U.S. assets. These two factors combined to drive substantial outperformance by longer-term government bonds, with the Barclays Capital U.S. Long Treasury Index doing the best of any U.S. fixed income sector.
Economic recovery hits escape velocity
The major economic story for the fourth quarter was the Fed’s move to stop stimulating the economy by buying bonds, signaling that, in the Fed’s judgment, the economy was now strong enough not to need the additional support.
The decision was driven by ongoing economic improvement, notably in employment. Although concerns remain, and the Fed continues to keep short-term interest rates at very low levels, it is now a matter of when rates will be increased.
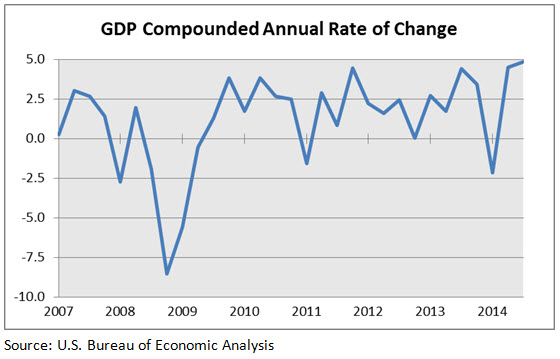
Because the data continues to show positive surprises, the next step in economic normalization (i.e., an interest rate hike) is widely expected to materialize in the first half of 2015. As of the end of 2014, the U.S. recovery was moving from strength to strength. Third-quarter results, noted previously, showed GDP growth of 5 percent, the strongest level since 2003. Moreover, as the chart shows below, there has been a consistent increase in the growth level over the past few years.
The increased growth has been driven by a substantial improvement in the employment situation. Just as with the GDP numbers, employment statistics have posted multiyear highs. November’s report, the most recent available, showed that:
- Total jobs had increased by 321,000, the highest level since early 2012.
- Job creation has now totaled more than 200,000 for the 10th straight month, the longest streak since 1995.
- The most recent three months have seen a total of 865,000 jobs created, the highest level since 1999.
- Through the first 11 months of 2014, the economy added 2,549,000 jobs, the highest level since 2000—even with one month to go in the year and a very weak first quarter.
Even the major remaining concern—slow wage growth—showed signs of improvement at year-end, along with increased consumer spending. These factors suggest that the economy could continue to grow at a healthy rate for the fourth quarter and into 2015.
Low oil prices surprise the world
Continued economic growth seems even more likely given the recent crash in the price of oil. Oil spot prices declined about 50 percent from their peak levels in 2014, with most of the decline coming in the last quarter. Declines in oil prices act as economic stimulus, with lower gasoline prices putting more money in the pockets of consumers, which can then get spent on other things, helping growth. Lower energy prices can also benefit companies, in the form of lower costs, which helps profit margins and potentially stock prices.
Because most of the oil price decline has been recent, we have probably not seen its full effect yet, which suggests that economic growth will continue to accelerate. Although there are some downsides to declining oil prices—in the form of lower investment and hiring, particularly in the energy sector—the overall impact is very positive.
Lower oil prices will also have a beneficial effect in many other areas of the world, especially in Europe and Japan. As noted above, both continue to stagnate economically, and lower energy costs will act as a much-needed stimulus, just as in the U.S.
Although low oil prices will not last forever, at this point it appears likely that prices will remain low through most of 2015, which should act as a continuing stimulus to the U.S. and global economies.
U.S. picture good, but risks remain
With the U.S. economy showing signs of continued growth, 2015 is getting underway on a positive note, but substantial risks remain, and investors should be cautious.
Looking at the world as a whole, Europe and Japan are at risk economically, and, in the case of Europe, at risk politically. In addition, even though China’s growth has continued strong, its rising debt has forced the government to continue stimulus, suggesting that risk remains. Perhaps most worrisome, though, is Russia, which ended 2014 in economic crisis and remains in a geopolitical faceoff with Europe and the U.S. over Ukraine.
Here in the U.S., despite strong economic and corporate fundamentals, stock market valuations are very high. The potential for earnings downgrades due to the strong dollar and poor results from the energy sector is very real. Although expected earnings growth has already been downgraded for 2015, the risk of overvaluation remains.
Even with all these risks, we enter 2015 in a much better place than we were at the beginning of 2014. The U.S. economy is solid, the trends are good, and we are well positioned to overcome any challenges. As always, a long-term perspective and a diversified portfolio are the best ways to take advantage of the many opportunities and overcome the many risks.
All information according to Bloomberg, unless stated otherwise.
Disclosure: Certain sections of this commentary contain forward-looking statements that are based on our reasonable expectations, estimates, projections, and assumptions. Forward-looking statements are not guarantees of future performance and involve certain risks and uncertainties, which are difficult to predict. Past performance is not indicative of future results. Diversification does not assure a profit or protect against loss in declining markets. All indices are unmanaged and investors cannot invest directly into an index. The Dow Jones Industrial Average is a price-weighted average of 30 actively traded blue-chip stocks. The S&P 500 Index is a broad-based measurement of changes in stock market conditions based on the average performance of 500 widely held common stocks. The Nasdaq Composite Index measures the performance of all issues listed in the Nasdaq Stock Market, except for rights, warrants, units, and convertible debentures. The MSCI EAFE Index is a float-adjusted market capitalization index designed to measure developed market equity performance, excluding the U.S. and Canada. The MSCI Emerging Markets Index is a market capitalization-weighted index composed of companies representative of the market structure of 26 emerging market countries in Europe, Latin America, and the Pacific Basin. It excludes closed markets and those shares in otherwise free markets that are not purchasable by foreigners. The Barclays Capital Aggregate Bond Index is an unmanaged market value-weighted index representing securities that are SEC-registered, taxable, and dollar-denominated. It covers the U.S. investment-grade fixed-rate bond market, with index components for a combination of the Barclays Capital government and corporate securities, mortgage-backed pass-through securities, and asset-backed securities. The Barclays Capital Long U.S. Treasury Index includes all publicly issued U.S. Treasury securities that have a remaining maturity of 10 or more years, are rated investment grade, and have $250 million or more of outstanding face value.
###
Summit Financial Corporation
7 New England Executive Park
Suite 220
Burlington, MA 01803
Tel: (781) 229-9500
Fax: (781) 229-2700
www.summitfinancialcorp.com
Authored by Brad McMillan, senior vice president, chief investment officer, at Commonwealth Financial Network.
© 2015 Commonwealth Financial Network®
Written by Summit Blog Admin
![]()